
How to Setup Google Data Studio

Google Data Studio is a powerful data visualization tool that allows you to create interactive and customizable reports and dashboards using various data sources. Here’s a step-by-step guide on how to set up Google Data Studio:
- Access Google Data Studio:
- Open your web browser and go to Google Data Studio. Make sure you are signed in with the Google account you want to use for Data Studio.
- Create a New Report:
- Click the “Start a new report” button on the Data Studio home page.
- Choose a Data Source:
- Data Studio integrates with various data sources, including Google Analytics, Google Sheets, Google Ads, and many other third-party connectors. To choose a data source:
- Click “Create new data source.”
- Select your data source from the list or use the search bar to find it.
- Data Studio integrates with various data sources, including Google Analytics, Google Sheets, Google Ads, and many other third-party connectors. To choose a data source:
- Connect to Your Data Source:
- Follow the prompts to connect to your data source. The steps will vary depending on the data source you choose, but you may need to authorize access and configure connection settings. For Google services like Google Analytics, you may be prompted to select an account and property.
- Build Your Data Source:
- In the Data Source configuration, you’ll often need to select specific data fields or dimensions you want to use in your report. Customize your data source settings as needed.
- Create Your Report:
- Once your data source is set up, you’ll be directed to the report editor. Here, you can design your report and add data visualizations, text boxes, and other elements.
- To add a chart or visualization, click the “Add a chart” button.
- To add text or images, use the “Text” and “Image” tools.
- Customize your report’s layout and style by dragging and dropping elements.
- Once your data source is set up, you’ll be directed to the report editor. Here, you can design your report and add data visualizations, text boxes, and other elements.
- Design Your Report:
- Customize the appearance of your report by changing fonts, colors, and other style settings. You can also add page-level filters, data controls, and interactive features.
- Add Pages and Widgets:
- To create a multi-page report or dashboard, use the “Add a page” button. You can add multiple pages and organize your content as needed.
- Add widgets like charts, tables, scorecards, and more to your report pages. Customize each widget’s data source and settings.
- Create Interactivity:
- Data Studio allows you to create interactive reports. For instance, you can use data controls like date pickers and drop-down menus to filter data in real-time.
- Share Your Report:
- To share your report, click the “Share” button at the top right corner of the screen. You can share it with specific people or generate a shareable link.
- Customize the permissions (view or edit) for the people you share the report with.
- View and Export Your Report:
- Click the “View” button to see how your report looks to viewers.
- To export your report, use the “File” menu to download it as a PDF or other format.
- Schedule Automatic Updates (if applicable):
- If your data source allows it, you can schedule automatic updates for your reports.
- Collaborate and Iterate:
- Data Studio supports collaboration, so you can work on reports with team members and make updates as needed.
Remember that the steps may vary slightly depending on the specific data source you’re using, but the general process remains the same. Google Data Studio provides a flexible and user-friendly way to create and share data-driven reports and dashboards.


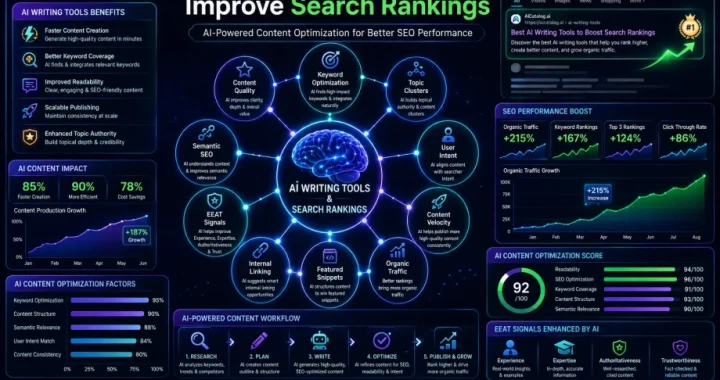 How AI Writing Tools Improve Search Rankings
  Business class flights worldwide: Travel in comfort for less
  The ultimate guide to finding Delta Air Lines flash sales and daily deals
  Do Dham Yatra Transport Options: Helicopter Vs. Road
2 thoughts on “How to Setup Google Data Studio”
Comments are closed.